- Consumer 150
- Posts
- Global Coffee Market
Global Coffee Market
Production dynamics, consumption trends, and price pressures shaping coffee’s next decade.

Introduction
Coffee is more than a beverage — it is a deeply embedded global ritual, a powerful consumer category, and a key revenue driver for companies across retail, hospitality, and consumer goods. From high-end cafés in urban centers to instant sachets in remote villages, coffee touches nearly every corner of the world. Its significance spans not only cultures and routines, but also economies, supply chains, and evolving consumption patterns.
In recent years, the global coffee market has undergone a quiet transformation. Consumers are increasingly seeking quality, origin transparency, and convenience — fueling innovation across formats and intensifying competition between traditional roast and instant products. Meanwhile, macroeconomic pressures, climate risks, and demographic shifts are influencing how and where coffee is produced and consumed.
Understanding the shape and structure of the global coffee market is crucial for any business that plays in food & beverage, fast-moving consumer goods (FMCG), or retail strategy. It offers a window into global demand resilience, consumer habits, and premiumization trends — all of which are central to forecasting future growth opportunities.
As of 2024, the total addressable market (TAM) for coffee — including both roast and instant categories — stands at $461.25 billion. This market is forecast to grow to $521.89 billion by 2029, representing a compound annual growth rate (CAGR) of 2.50% over the five-year period. This steady growth reflects both volume expansion in emerging markets and the continued premiumization of coffee in developed economies.
Roast coffee remains the dominant segment within the category, generating $323.39 billion in 2024 and accounting for 70.1% of total market value. It is expected to grow at a CAGR of 2.64%, reaching $368.65 billion by 2029. Growth in this segment is largely driven by demand for specialty brews, café culture, and at-home brewing formats.
Meanwhile, instant coffee represents a smaller but resilient share of the market, with a 2024 value of $137.86 billion and a projected CAGR of 2.11%, reaching $153.24 billion by 2029. Its appeal remains strong in markets where convenience, affordability, and shelf life are priorities — particularly across Asia, Latin America, and parts of Eastern Europe.

These figures signal a stable but mature market, where the battleground lies in product differentiation, pricing power, and adapting to shifting consumer preferences across regions.
Long-Term Production Trends
Coffee production is inherently volatile — influenced by climate conditions, labor dynamics, political instability, and global demand patterns. Yet over the past decade, the global coffee supply chain has demonstrated remarkable resilience, managing to maintain a relatively steady upward trend despite a series of disruptive events.
From the 2015/16 crop year to 2023/24, global coffee production increased from 156.13 million to 178 million 60-kilogram bags, marking a 14% total growth across this period. The overall trend has been one of slow but steady expansion, with a few notable fluctuations along the way.

The years 2016/17 through 2018/19 saw consistent annual increases, reaching a high of 169.80 million bags in 2018/19. This period benefited from favorable weather conditions in Brazil and improved crop yields in Vietnam and Colombia.
Production dipped slightly in 2019/20 to 168.40 million bags, driven by lower output from Latin America, especially due to Brazil's biennial bearing cycle and erratic weather. However, the market quickly rebounded in 2020/21, reaching 170.80 million bags, only to see a temporary contraction again in the following two crop years (2021/22 and 2022/23) amid the economic disruptions of COVID-19 and extreme weather patterns — including frost in Brazil and heavy rains in Colombia.
The latest estimate for 2023/24 shows a strong recovery, with global production reaching 178 million bags — the highest point in nearly a decade. This resurgence is largely attributed to a record off-cycle crop in Brazil, improved growing conditions across Asia, and expanded planting areas in Africa.
Looking forward, production is likely to remain sensitive to both climatic pressures — such as El Niño effects and long-term climate change — and economic uncertainties like input cost inflation, labor shortages, and currency instability in key producing nations. However, investments in technology, sustainability practices, and crop resilience are helping stabilize yields and prepare the industry for future shocks.
2024 Coffee Production by Region
Coffee cultivation is deeply tied to geography. Climate, elevation, soil type, and infrastructure all influence where coffee thrives — and how much of it reaches global markets. In 2024, production remains highly concentrated in a few key regions, with South America continuing to dominate the global supply chain.
Global coffee production for the year totals approximately 178 million 60-kilogram bags, and over half of that—50.2%—comes from South America alone. This is largely due to Brazil, which remains the undisputed global leader in both arabica and robusta output. Brazil’s 2024 harvest rebounded strongly after previous climate setbacks, thanks to improved rainfall and favorable growing conditions. Colombia, another major player in the region, has also seen stable production due to government-backed sustainability initiatives and investments in climate-resilient coffee varieties.
The Asia & Oceania region ranks second, contributing 28.0% of global production. Vietnam is the key driver here, particularly in robusta output. Though susceptible to volatile weather and rising fertilizer costs, Vietnam’s efficient farming techniques and government support have helped stabilize yields. Other contributors include Indonesia and India, both of which are seeing incremental improvements due to better post-harvest processing and modernization efforts.
Africa accounts for 11.3% of global coffee production in 2024. While its share is modest, the region holds significant long-term potential. Ethiopia remains a major exporter of specialty-grade arabica, and Uganda is gaining ground with robusta. However, challenges around infrastructure, market access, and farm-level productivity continue to limit growth.
Finally, Caribbean, Central America, and Mexico make up 10.5% of total production. While these countries—especially Honduras, Guatemala, and Mexico—are renowned for high-quality arabicas, their output remains constrained by aging trees, climate variability, and limited investment in farm modernization.
While South America and Asia remain the dominant producers by volume, future growth opportunities may emerge from Africa and Central America—provided that challenges related to infrastructure, climate adaptation, and financing are addressed. As climate risks intensify, geographic diversification may also become increasingly important for global buyers seeking stable, long-term supply.

Top Producing Countries
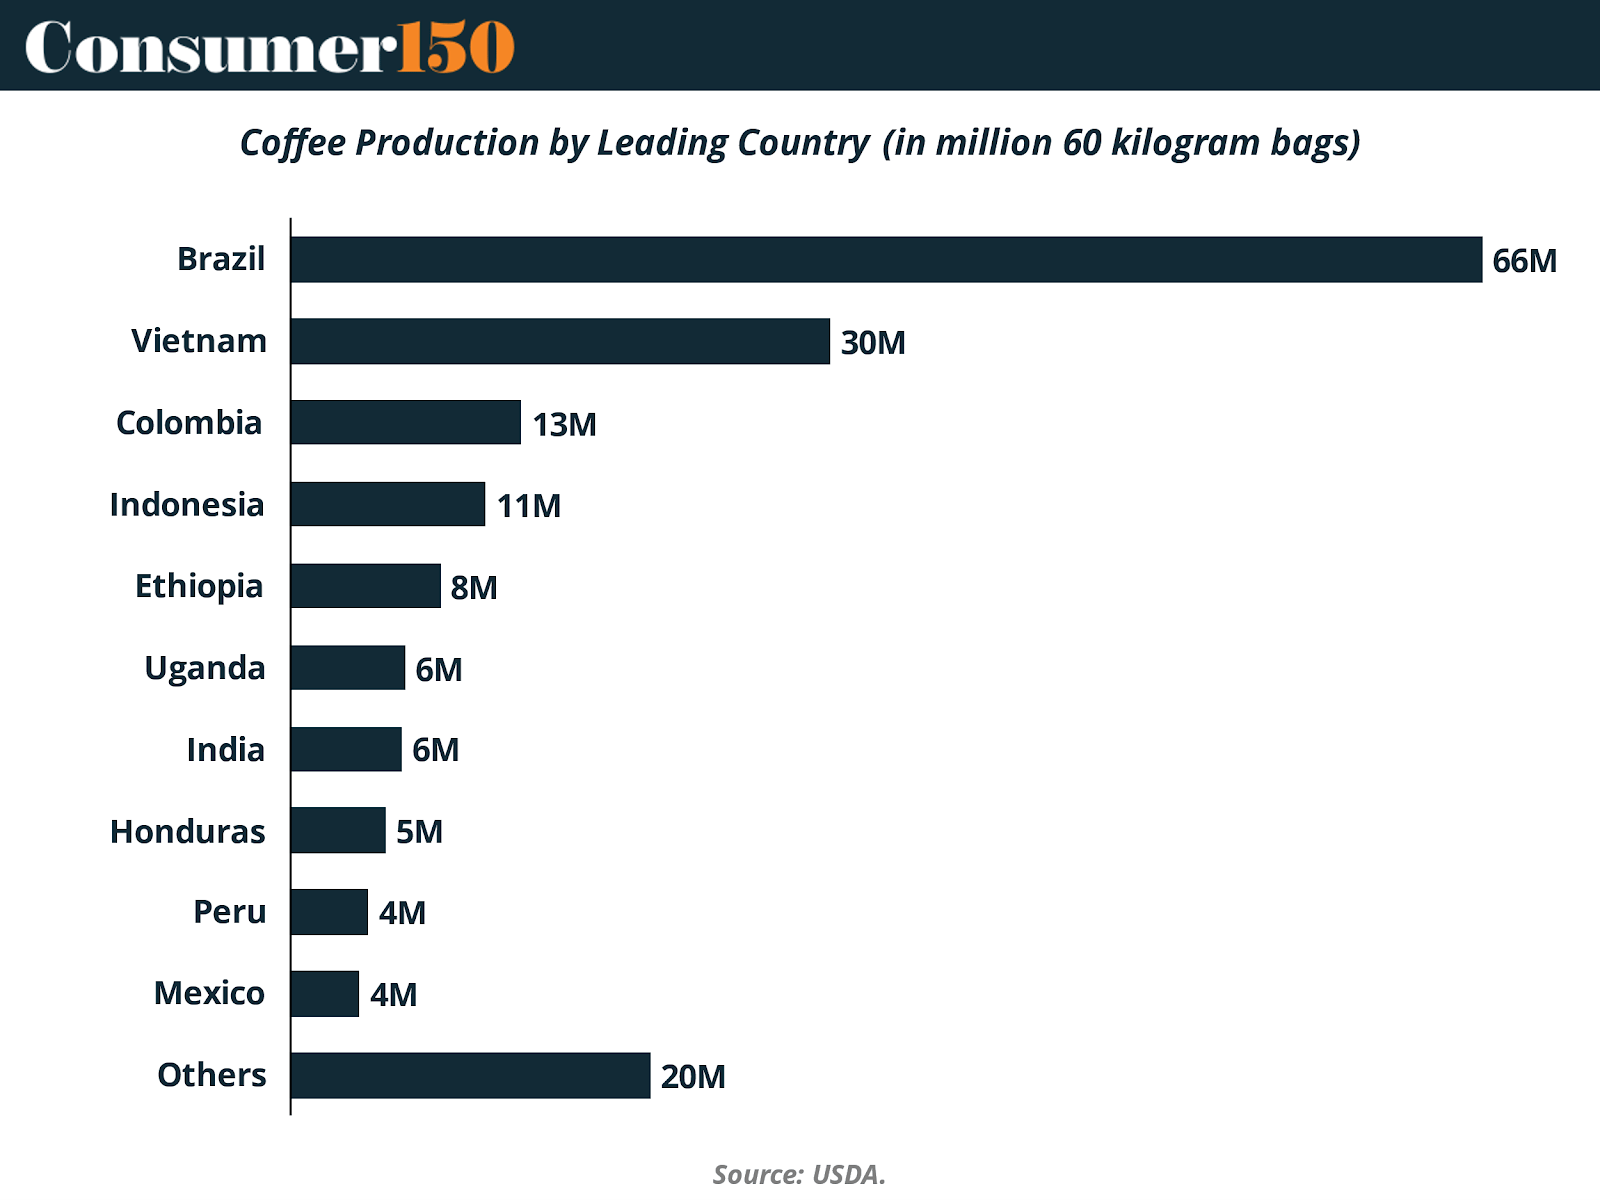
Coffee production remains highly concentrated among a small group of countries, each shaped by unique agronomic, climatic, and economic conditions. In the 2024/25 crop year, the five leading producers — Brazil, Vietnam, Colombia, Indonesia, and Ethiopia — together account for over 70% of the global supply, underscoring their continued dominance in shaping global trade flows and pricing dynamics.
Brazil: The Indispensable Leader
Brazil remains the world's undisputed coffee powerhouse, producing 66.4 million 60-kg bags in 2024/25 — more than double the output of any other single country. The country’s dominance is due to its vast growing area, advanced mechanization, and diversity of both arabica and robusta cultivation. Despite occasional volatility from droughts and frost events, Brazil's production capacity continues to recover rapidly, aided by improved agronomic practices and investment in climate-resilient varietals.
Vietnam: Robusta Specialist and Stable Challenger
Vietnam solidifies its position as the second-largest producer with 30.1 million bags forecast for 2024/25. It is the world’s leading source of robusta beans, which are critical for instant coffee production and as blends for espresso roasts. Vietnamese farms benefit from intensive, high-density planting and state-supported productivity programs. However, rising fertilizer costs and water stress are emerging challenges that may affect longer-term growth without adaptation.
Colombia: Premium Arabica and Quality-Focused Growth
Colombia ranks third, with 12.9 million bags of primarily washed arabica expected in 2024/25. Known globally for its specialty-grade beans and consistent cup profile, Colombia has built a reputation that allows it to command price premiums. However, the country faces persistent threats from climate change, including erratic rainfall and rising temperatures in the Andes, which can impact flowering and harvest cycles. Nevertheless, renewed investments in sustainability and replanting programs have supported recent recovery from previous lows.
Rising and Stable Producers: Indonesia and Ethiopia
Indonesia’s coffee production is forecast at 10.9 million bags, rebounding strongly after a dip in 2023/24. The country’s strength lies in its robusta production, particularly in Sumatra, and it plays a vital role in regional supply to Southeast Asian markets. Meanwhile, Ethiopia, the birthplace of arabica coffee, continues its steady climb with 8.36 million bags expected this year. Its coffee sector remains fragmented but is undergoing modernization through traceability systems and farmer cooperatives.
Together, these countries shape the dynamics of the global coffee supply. While Brazil and Vietnam dominate in volume, Colombia and Ethiopia stand out for quality. Production growth in Africa and Asia signals long-term potential — especially as consumer demand for both high-end arabica and affordable robusta continues to rise.
Global Consumption Trends
Global coffee consumption has experienced a steady upward trajectory over the past decade, driven by rising demand across both developed and developing markets. From 2015/16 to 2023/24, global consumption rose from approximately 155.4 million 60-kilogram bags to an estimated 177 million bags, representing a 14% increase in under a decade.
The trend has been remarkably resilient. After gradually rising from 155.4 million in 2015/16 to 171.2 million in 2018/19, consumption dipped slightly to 168.6 million in 2019/20. This decline coincided with the onset of the COVID-19 pandemic, which disrupted out-of-home consumption in cafés, restaurants, and offices. Despite these headwinds, the market began recovering quickly — reaching 169.9 million in 2020/21 and surging to 176.6 million in 2021/22, a then-record high.
A modest decline to 173.1 million in 2022/23 reflected ongoing global uncertainty and inflationary pressures, but growth resumed in 2023/24, with consumption reaching a new high of 177 million bags.
Much of this expansion is fueled by emerging economies, particularly in Asia and Latin America, where rising incomes, urbanization, and changing consumer behavior are encouraging greater coffee adoption. In these regions, coffee is increasingly embraced as both an everyday beverage and a social experience. Meanwhile, mature markets such as Europe and North America are largely saturated but remain stable, with incremental gains driven by premiumization, specialty formats, and ready-to-drink products.
While per capita intake remains significantly higher in developed countries, the gap is slowly narrowing. Global trends — including younger consumers favoring coffee over traditional soft drinks and tea — suggest that developing markets will continue to drive volume growth in the medium term.

Coffee Trade: Top Importers and Exporters
Global coffee trade remains highly concentrated, with a few countries leading on both the import and export sides. In 2024, the United States was the largest importer, purchasing $8.99 billion worth of coffee. Germany followed with $5.63 billion, then France ($3.42B), Italy ($3.10B), and Canada ($1.89B). Other top importers included Spain, Japan, Netherlands, Switzerland, and the United Kingdom, all importing over $1.4 billion each — reflecting the beverage’s strong global demand across Western markets.
On the export side, Brazil retained its leadership, shipping $11.37 billion in coffee — far ahead of others thanks to its massive production scale. Interestingly, Switzerland ranked second with $3.95B in exports, despite minimal coffee farming — underscoring its role as a value-added hub through brands like Nespresso. Germany ($2.71B) and the Netherlands ($1.38B) also play key roles in roasting and re-exporting.
This reveals a clear split between volume and value: while countries like Brazil and Vietnam (not in top 10 by value but still critical in volume) lead in raw bean production, others like Switzerland and Germany thrive by exporting processed, branded coffee. The rise of value-added exports highlights how coffee’s economic impact extends far beyond the farm — and how controlling more of the supply chain can significantly boost trade revenues.

Pricing Dynamics
Coffee Prices vs. Consumer Inflation (2015–2025)
Over the past decade, coffee prices have experienced moderate growth. From 2015 to 2025, the Coffee Consumer Price Index (CPI) rose from 208.4 to 264.1, marking a +26.7% increase. This reflects a long-term upward trend shaped by steady demand, rising labor and transportation costs, and the growing impact of climate risks on production.
But the story changes when looking at the last five years. Between 2020 and 2025, the Coffee CPI jumped from 208.3 to 264.1, a +26.8% increase in just half the time. Much of this spike occurred between 2021 and 2022, driven by supply shocks like the Brazilian drought and frost events, as well as global supply chain disruptions. Prices surged from 213.5 in January 2021 to 252.3 by August 2022, then leveled off in 2023–2024, with only moderate gains since.
By comparison, general consumer inflation has also been significant. The overall U.S. CPI rose from 258.7 in January 2020 to 321.5 in January 2025, a +24.3% increase, roughly mirroring the pace of coffee inflation over that period.
In short, while coffee prices have risen over 10 years, the bulk of the increase has come in the past five, making the category especially sensitive to short-term shocks. The trend has now begun to stabilize, but prices remain elevated relative to pre-pandemic levels.

Divergence Between Producer and Consumer Coffee Prices (2015–2025)
Between January 2015 and June 2025, the Producer Price Index (PPI) for processed coffee (including whole bean, ground, and instant) increased by 61.7%, while the Consumer Price Index (CPI) for coffee rose by only 26.8% over the same period.
This widening disparity suggests that cost increases at the production and processing level have not been fully passed through to end consumers. The pressure on roasters, distributors, and retailers to absorb rising input costs likely reflects a combination of market competition, pricing sensitivity, and delayed pricing mechanisms.
Should elevated producer prices persist, the imbalance may necessitate adjustments in retail pricing strategies or lead to margin compression across the coffee value chain. The trend highlights the growing vulnerability of consumer goods sectors—particularly commodities like coffee—to upstream inflation that is not immediately reflected in consumer-facing prices.

Conclusion
The global coffee market, while mature in many respects, remains dynamic and highly responsive to economic, environmental, and consumer trends. From resilient production patterns across top-growing nations to evolving consumption behaviors and pricing pressures, coffee continues to reflect broader global shifts — in trade, inflation, and lifestyle.
Over the past decade, the market has demonstrated measured growth, driven by emerging demand in developing economies, ongoing premiumization in developed regions, and the diversification of formats and channels. South America and Asia continue to dominate production, yet opportunities for long-term growth in Africa and Central America are emerging, contingent on infrastructure investment and climate adaptation.
On the trade front, the dominance of countries like Brazil on the export side and the U.S. and EU nations on the import side illustrates the structural depth of the coffee economy. At the same time, the rise of value-added exports from nations like Switzerland signals a shift toward brand- and processing-led value capture.
Price dynamics further underscore the sector’s exposure to short-term shocks. While long-term price growth has been moderate, the recent surge in coffee prices — largely concentrated in the past five years — highlights the market’s sensitivity to supply chain disruptions, climate volatility, and macroeconomic uncertainty.
Ultimately, coffee remains a critical and culturally embedded global commodity, one that demands strategic attention from businesses across retail, consumer goods, and supply chain sectors. Those that can anticipate regional demand shifts, invest in resilient sourcing, and adapt to evolving consumer expectations will be best positioned to navigate and capitalize on the market’s next chapter.
Sources and References:
Coffee Production by country
https://apps.fas.usda.gov/psdonline/app/index.html#/app/advQuery
International Coffee Organization
https://ico.org/what-we-do/world-coffee-statistics-database/
U.S. Bureau of Labor Statistics, Consumer Price Index for All Urban Consumers: Coffee in U.S. City Average [CUSR0000SEFP01], retrieved from FRED, Federal Reserve Bank of St. Louis; https://fred.stlouisfed.org/series/CUSR0000SEFP01, August 1, 2025.
U.S. Bureau of Labor Statistics, Consumer Price Index for All Urban Consumers: All Items in U.S. City Average [CPIAUCSL], retrieved from FRED, Federal Reserve Bank of St. Louis; https://fred.stlouisfed.org/series/CPIAUCSL, August 1, 2025.
Premium Perks
Since you are an Executive Subscriber, you get access to all the full length reports our research team makes every week. Interested in learning all the hard data behind the article? If so, this report is just for you.
|

Want to check the other reports? Access the Report Repository here.